The short answer
ERPnBox gives every user a dashboard of count, list, pie, and bar cards, a role-aware overview home, seven click-to-drill chart types, KPIs with targets and rollups, leaderboards, and scheduled reports. The AI Assistant can build a full analytics dashboard, with a wider chart set, from a plain-language request.
Every business runs on numbers it can rarely see in time. ERPnBox turns the data you already have into dashboards, charts, and running scorecards, and it can build the whole dashboard for you from a plain-language request. This is the picture of your business, drawn for you.
What are dashboards and analytics in ERPnBox?

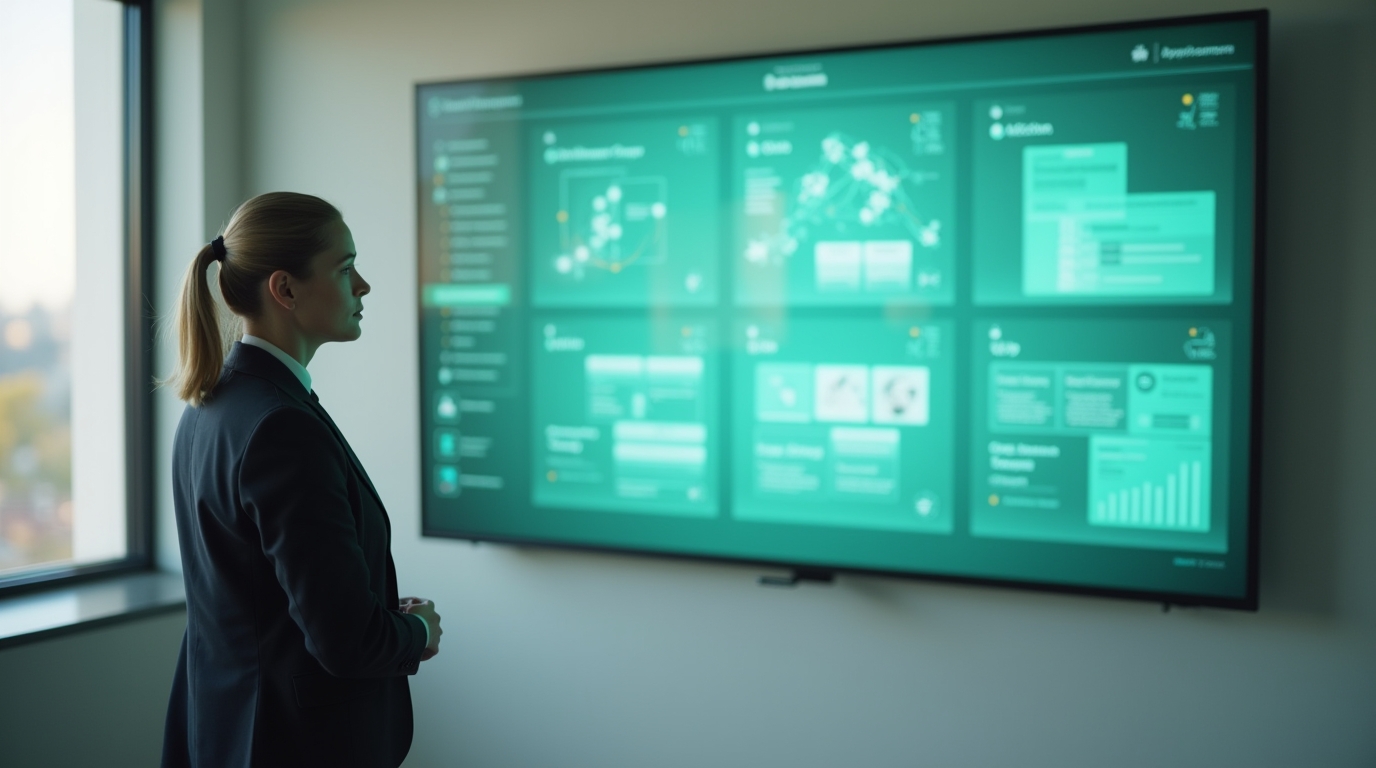
They are the layer that shows you where the business stands without you building a spreadsheet. Each person gets a dashboard of cards, an overview home tuned to their role, in-list charts they can click into, targets and leaderboards, and a report builder that emails itself on schedule. The AI Assistant can assemble a full dashboard from one request.
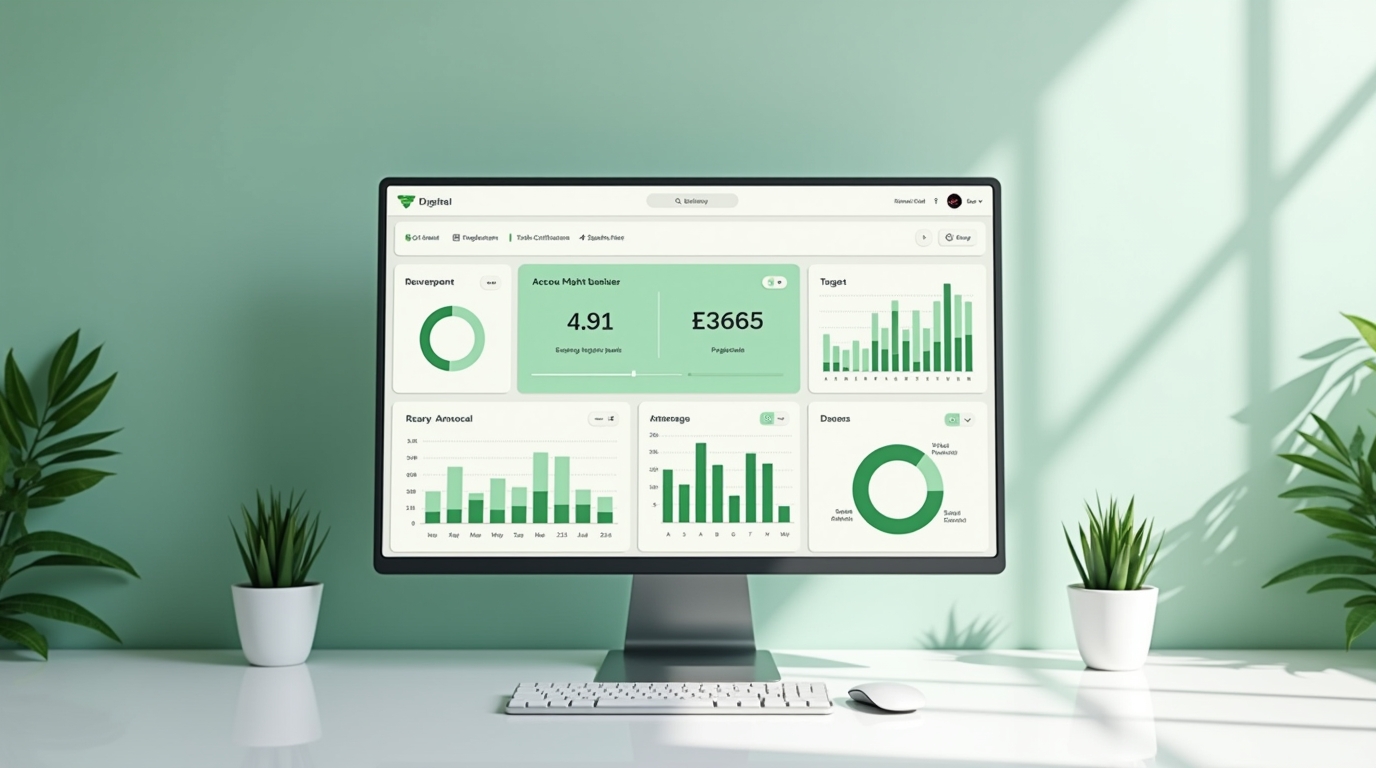
The building blocks are deliberately small. A personal dashboard is made of cards, and a card is one of four things: a big count, a mini list, a pie, or a bar. That constraint is a feature: nobody has to decode a wall of widgets. Above it sits an overview home that reads your role and combines attendance, your CRM counts, and, if you manage people, the status of your reportees.
Open any list of records and you can flip it into a chart, seven types in all: bar, column, line, area, pie, donut, and funnel. Click a slice or a bar and it drills straight down to the records behind it. The chart is not a dead-end picture; it is a way into the data.
Why does this matter for a business owner?
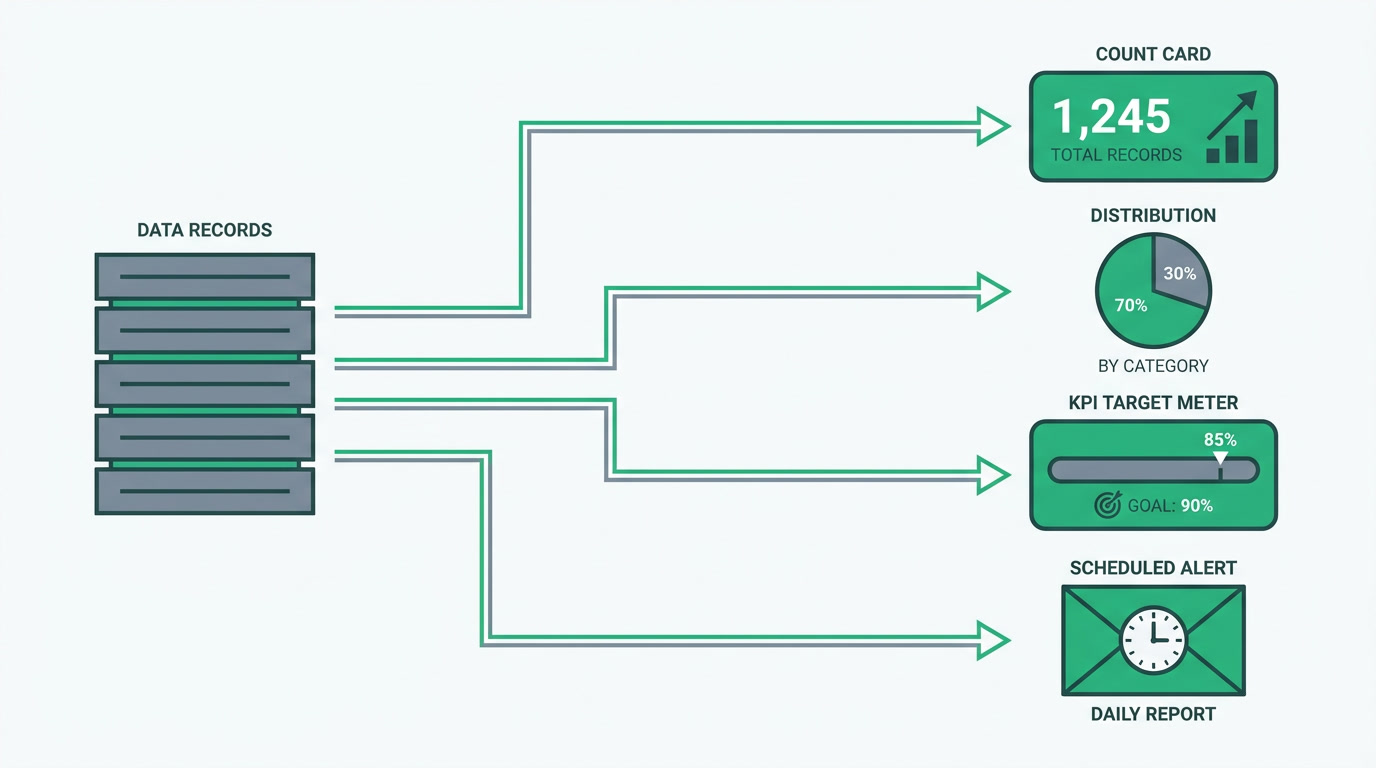
Because the usual alternative is a monthly ritual of exporting, pasting, and formatting, work that ages the moment it is done. ERPnBox removes the building step. The numbers assemble themselves from the records your team already enters, so the report you open on Monday reflects Friday, not last quarter.
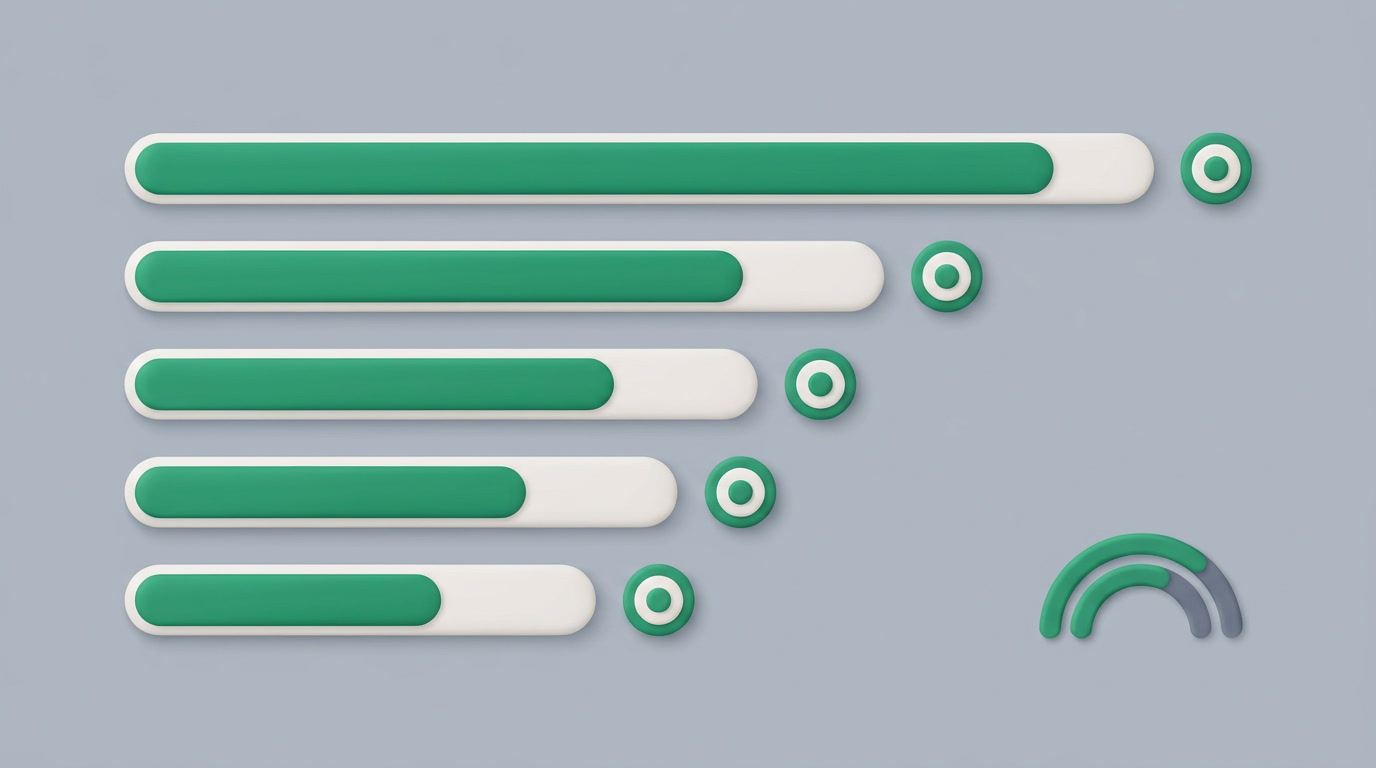
There is a second pain it removes: the gap between a target and reality. KPIs carry a target value and take snapshots over time, so a number is always measured against where it should be. Targets roll up a tree, and a manager can override the target for their own branch. Leaderboards rank people; target plans show live target-versus-actual per person per month, summed up the org chart. A sales lead stops asking who is behind and simply looks.
| What you want | How you get it |
|---|---|
| A quick personal view | Dashboard cards: count, list, pie, or bar |
| Explore a list visually | In-list chart view, 7 types, click to drill down |
| Track against a goal | KPIs with targets, snapshots, and rollup trees |
| Rank the team | Leaderboards and per-person target plans |
| A recurring report | Report builder, folders, scheduled email |
| A dashboard built for you | Ask the AI Assistant; it assembles it |
Who is this for, and which industries?
It fits any team run by numbers. Sales organizations lean on quotas and leaderboards; a KPI-driven operation of any kind, from a support desk to a delivery team, gets targets and snapshots; and managers who want the numbers without building them get an overview home and scheduled reports that arrive on their own. The tool adapts to the work, not the region.
A real-estate brokerage watches its pipeline funnel and agent leaderboard; a services firm tracks utilization against monthly targets; a retailer follows counts by branch. Same building blocks, different questions. Because the system is metadata-driven, the charts speak your own fields, not a template's.
See it on your own numbers
Start a 30-day free trial, no card required, and let ERPnBox draw the picture.
Start free trialHow do you set up a dashboard?
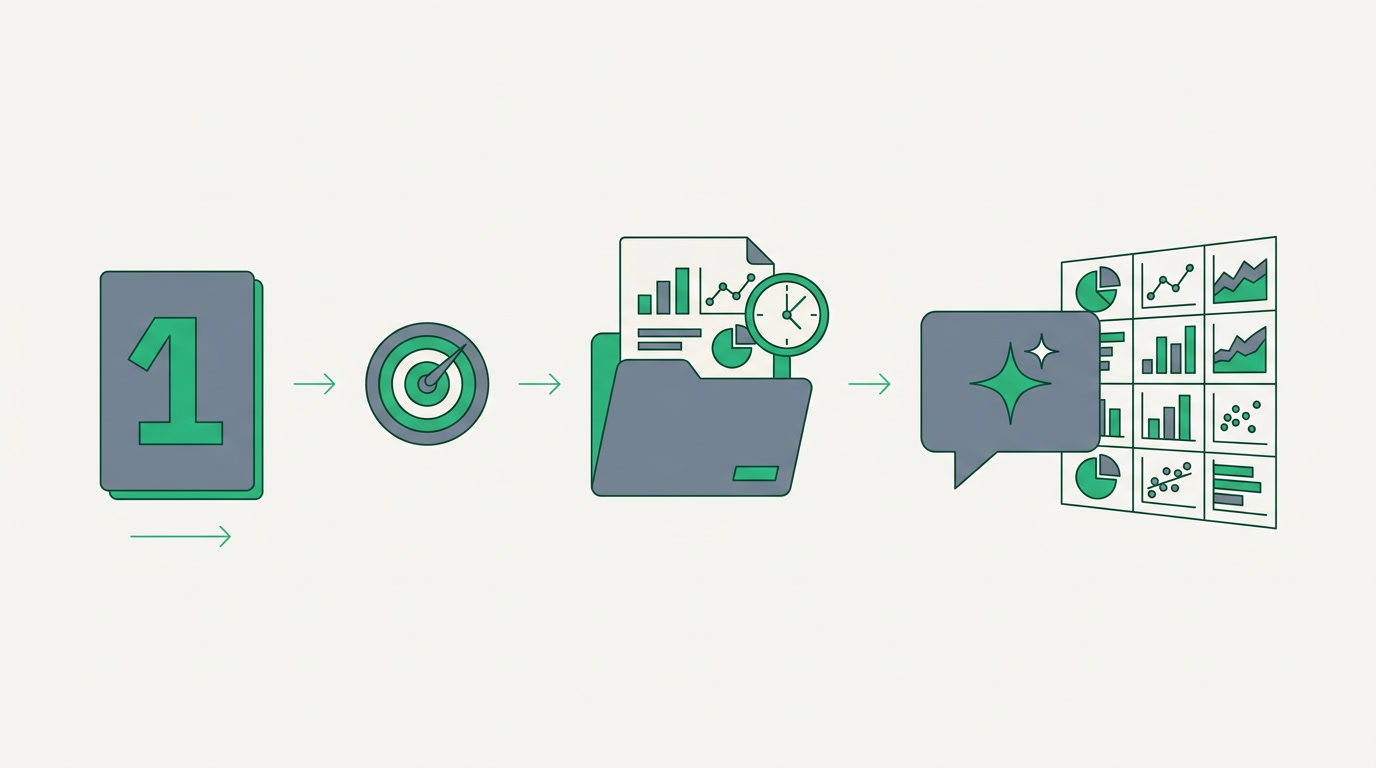
You have two honest routes. Build it yourself in a few minutes, or ask the AI Assistant to do it. Both draw on the same records, so you can start with one and refine with the other. Here is the practical path from empty screen to a dashboard your team opens every day.
- Add a card. Pick a module, a display type (count, list, pie, or bar), and a measure such as count or sum. Repeat for the handful of numbers you check daily.
- Set your targets. Give each KPI a target value; snapshots then track progress over time on their own.
- Roll it up the org tree. Let targets sum up the hierarchy, and override a branch's target where a manager needs a different bar.
- Save a report. In the report builder, choose row groups and aggregate columns, tuck it in a folder, and set it to email on a schedule.
- Or just ask. Tell the AI Assistant what you want to see; it builds a full analytics dashboard, reaching for a wider chart set, KPI tiles, stacked bars, radar, treemap, sankey, target meters, and tables, when a question calls for one.
One honest note on scope. The four card types on a personal dashboard, and the seven chart types inside a list, are the everyday set. The exotic charts, radar, treemap, sankey, target meters and the rest, come through the AI and analytics path. Knowing the line keeps expectations clean and the screen readable.
That is the whole idea. You stop assembling the picture of your business and start reading it, whether you drew it in a few clicks or asked for it in a sentence. Your business, unboxed.
Frequently asked questions
How many chart types can I use?
The in-list chart view gives you **seven: bar, column, line, area, pie, donut, and funnel**, each one clickable to drill into the records behind it. Personal dashboard cards use four display types: count, list, pie, and bar. A wider set of chart types is available through the AI Assistant and analytics path.
Can the AI really build a dashboard for me?
Yes. Describe what you want to see and the AI Assistant **assembles a full analytics dashboard from your records**, drawing on a wider chart set that includes KPI tiles, stacked bars, radar, treemap, sankey, target meters, and tables. You can then adjust it by hand.
How do targets and leaderboards work?
Each KPI carries a target value and takes snapshots over time. **Targets roll up the org tree**, and a manager can override the target for their branch. Leaderboards rank people, and target plans show live target-versus-actual per person per month, summed up the hierarchy.
Can reports be emailed automatically?
Yes. In the report builder you choose row groups and aggregate columns, organize saved reports in folders, and **set a schedule to email them**. The recipients get a fresh report without anyone exporting or formatting anything.
Does the overview home differ by role?
Yes. The overview home is **role-aware**. It combines attendance, your CRM counts, and, for anyone who manages people, the status of their reportees, so each person opens a home tuned to their own responsibilities rather than a generic screen.
Do I need a data analyst to use it?
No. Cards are built by picking a module, a display type, and a measure, and the AI Assistant can **build a whole dashboard from a plain request**. Managers who want the numbers without building them get an overview home and scheduled reports that arrive on their own.