
The short answer
ERPnBox's Report Builder turns your records into saved reports: choose columns, group rows by a field, add aggregate columns that sum or count, organize in folders, and share with the team. Best of all, schedule each report to email itself — daily, weekly, or monthly.
Somewhere in your business, a question is going unanswered. Which salesperson closed the most this quarter. Which deals stalled. Which invoices are overdue and by how much. The data exists — it's sitting in your records right now — but getting it out means a spreadsheet export, an afternoon of copy-paste, and a chart that's stale by Monday. The Report Builder in ERPnBox is how you skip all of that: you build the report once, and it answers the question for you, on a schedule, forever.
What is the ERPnBox Report Builder?
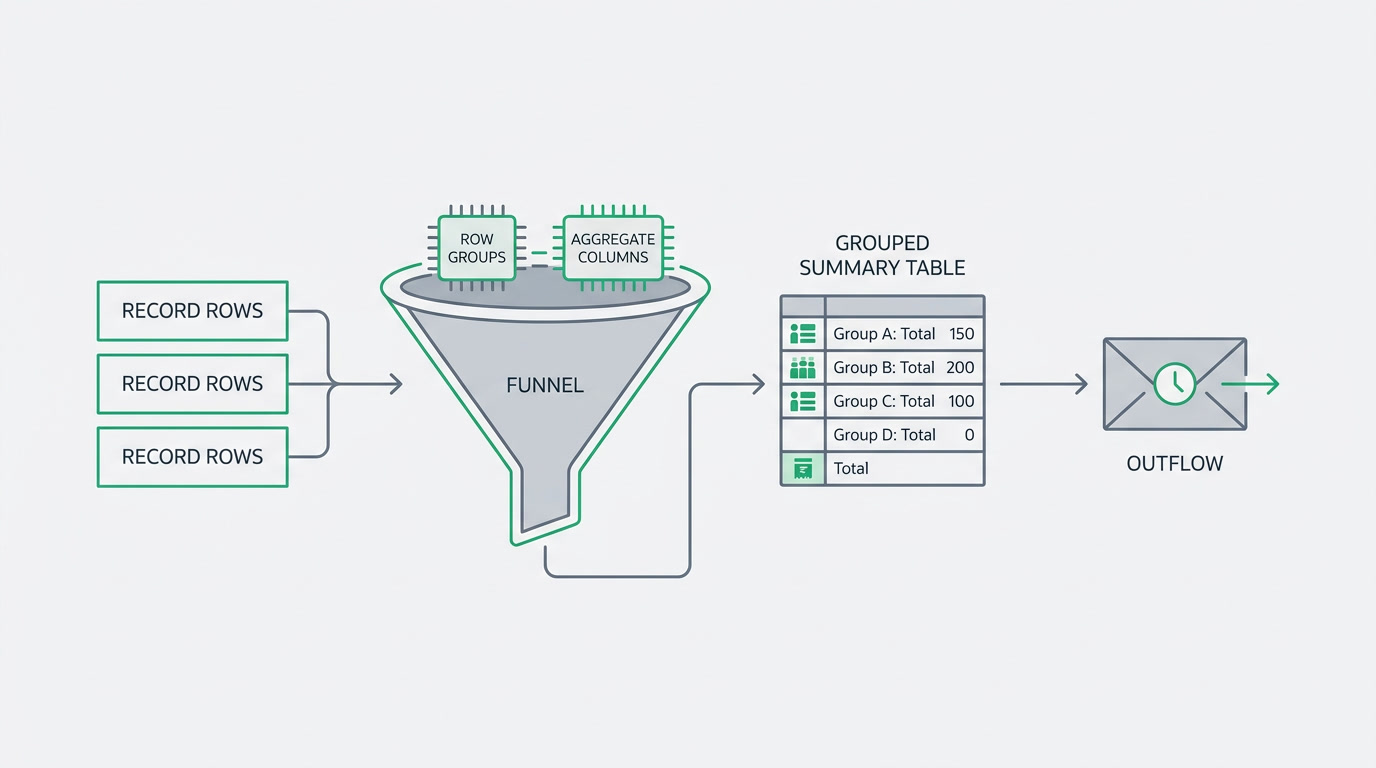
It's a tool for turning your records into answers. You pick a module — leads, deals, invoices, tickets, anything — choose the columns you want, group the rows by a field like owner or stage, and add aggregate columns that sum, average, or count. Save it, drop it in a folder, share it with your team, and set it to email itself on a schedule. No query language. No data team. Just the question, and the answer that keeps arriving.
Under the hood, every saved report holds its own recipe: the visible columns, the filters, the row group, the aggregates, and the sort order. You can view the same report as a flat table, a grouped summary, or a matrix that crosses two dimensions — deals by owner across each stage, say. And because it lives inside the same platform as your CRM, HR, and Finance, the numbers are the real numbers, not a copy that drifted out of date the moment it was exported.
Why does building your own reports matter?
Because the alternative is expensive in a way that doesn't show up on an invoice. When answers require a specialist, questions go unasked. The report that would have caught the dip in follow-ups never gets built, because building it is somebody else's job and that somebody is busy. A report builder that a business owner can drive removes the gatekeeper. The person who has the question is the person who gets the answer.
Scheduled email is the quiet hero here. A report you have to remember to open is a report you'll forget. A report that lands in your inbox every Monday at nine — and in your sales manager's inbox, and your finance lead's — becomes part of how the business thinks. Choose daily, weekly, monthly, or a custom cadence; pick who receives it; choose CSV or a spreadsheet file. Then never think about it again.
| Building block | What it does |
|---|---|
| Row groups | Collapse records under a field — owner, stage, month, city — so a thousand rows become a readable summary. |
| Aggregate columns | Sum, average, count, minimum, or maximum on any number field, per group and overall. |
| Folders | Organize reports in nested folders — Sales, Finance, Ops — so the right report is always findable. |
| Sharing | Mark a report shared and the whole team works from the same numbers, not five private versions. |
| Scheduled email | Daily, weekly, monthly, or custom delivery as CSV or spreadsheet to any list of recipients. |
| Timeline reports | Report on the trail itself — who changed what, and when — across your records over any period. |
Who uses it, and for what?
Anyone who runs on numbers, which is everyone. A sales lead groups deals by owner and sums the value to see the pipeline by rep. A finance lead groups invoices by status and sums the balance to see what's outstanding. An ops manager reports on tickets by priority. The Report Builder doesn't know or care which industry you're in — a property developer tracking units, a clinic tracking appointments, an agency tracking retainers all shape the same tool to their own questions.
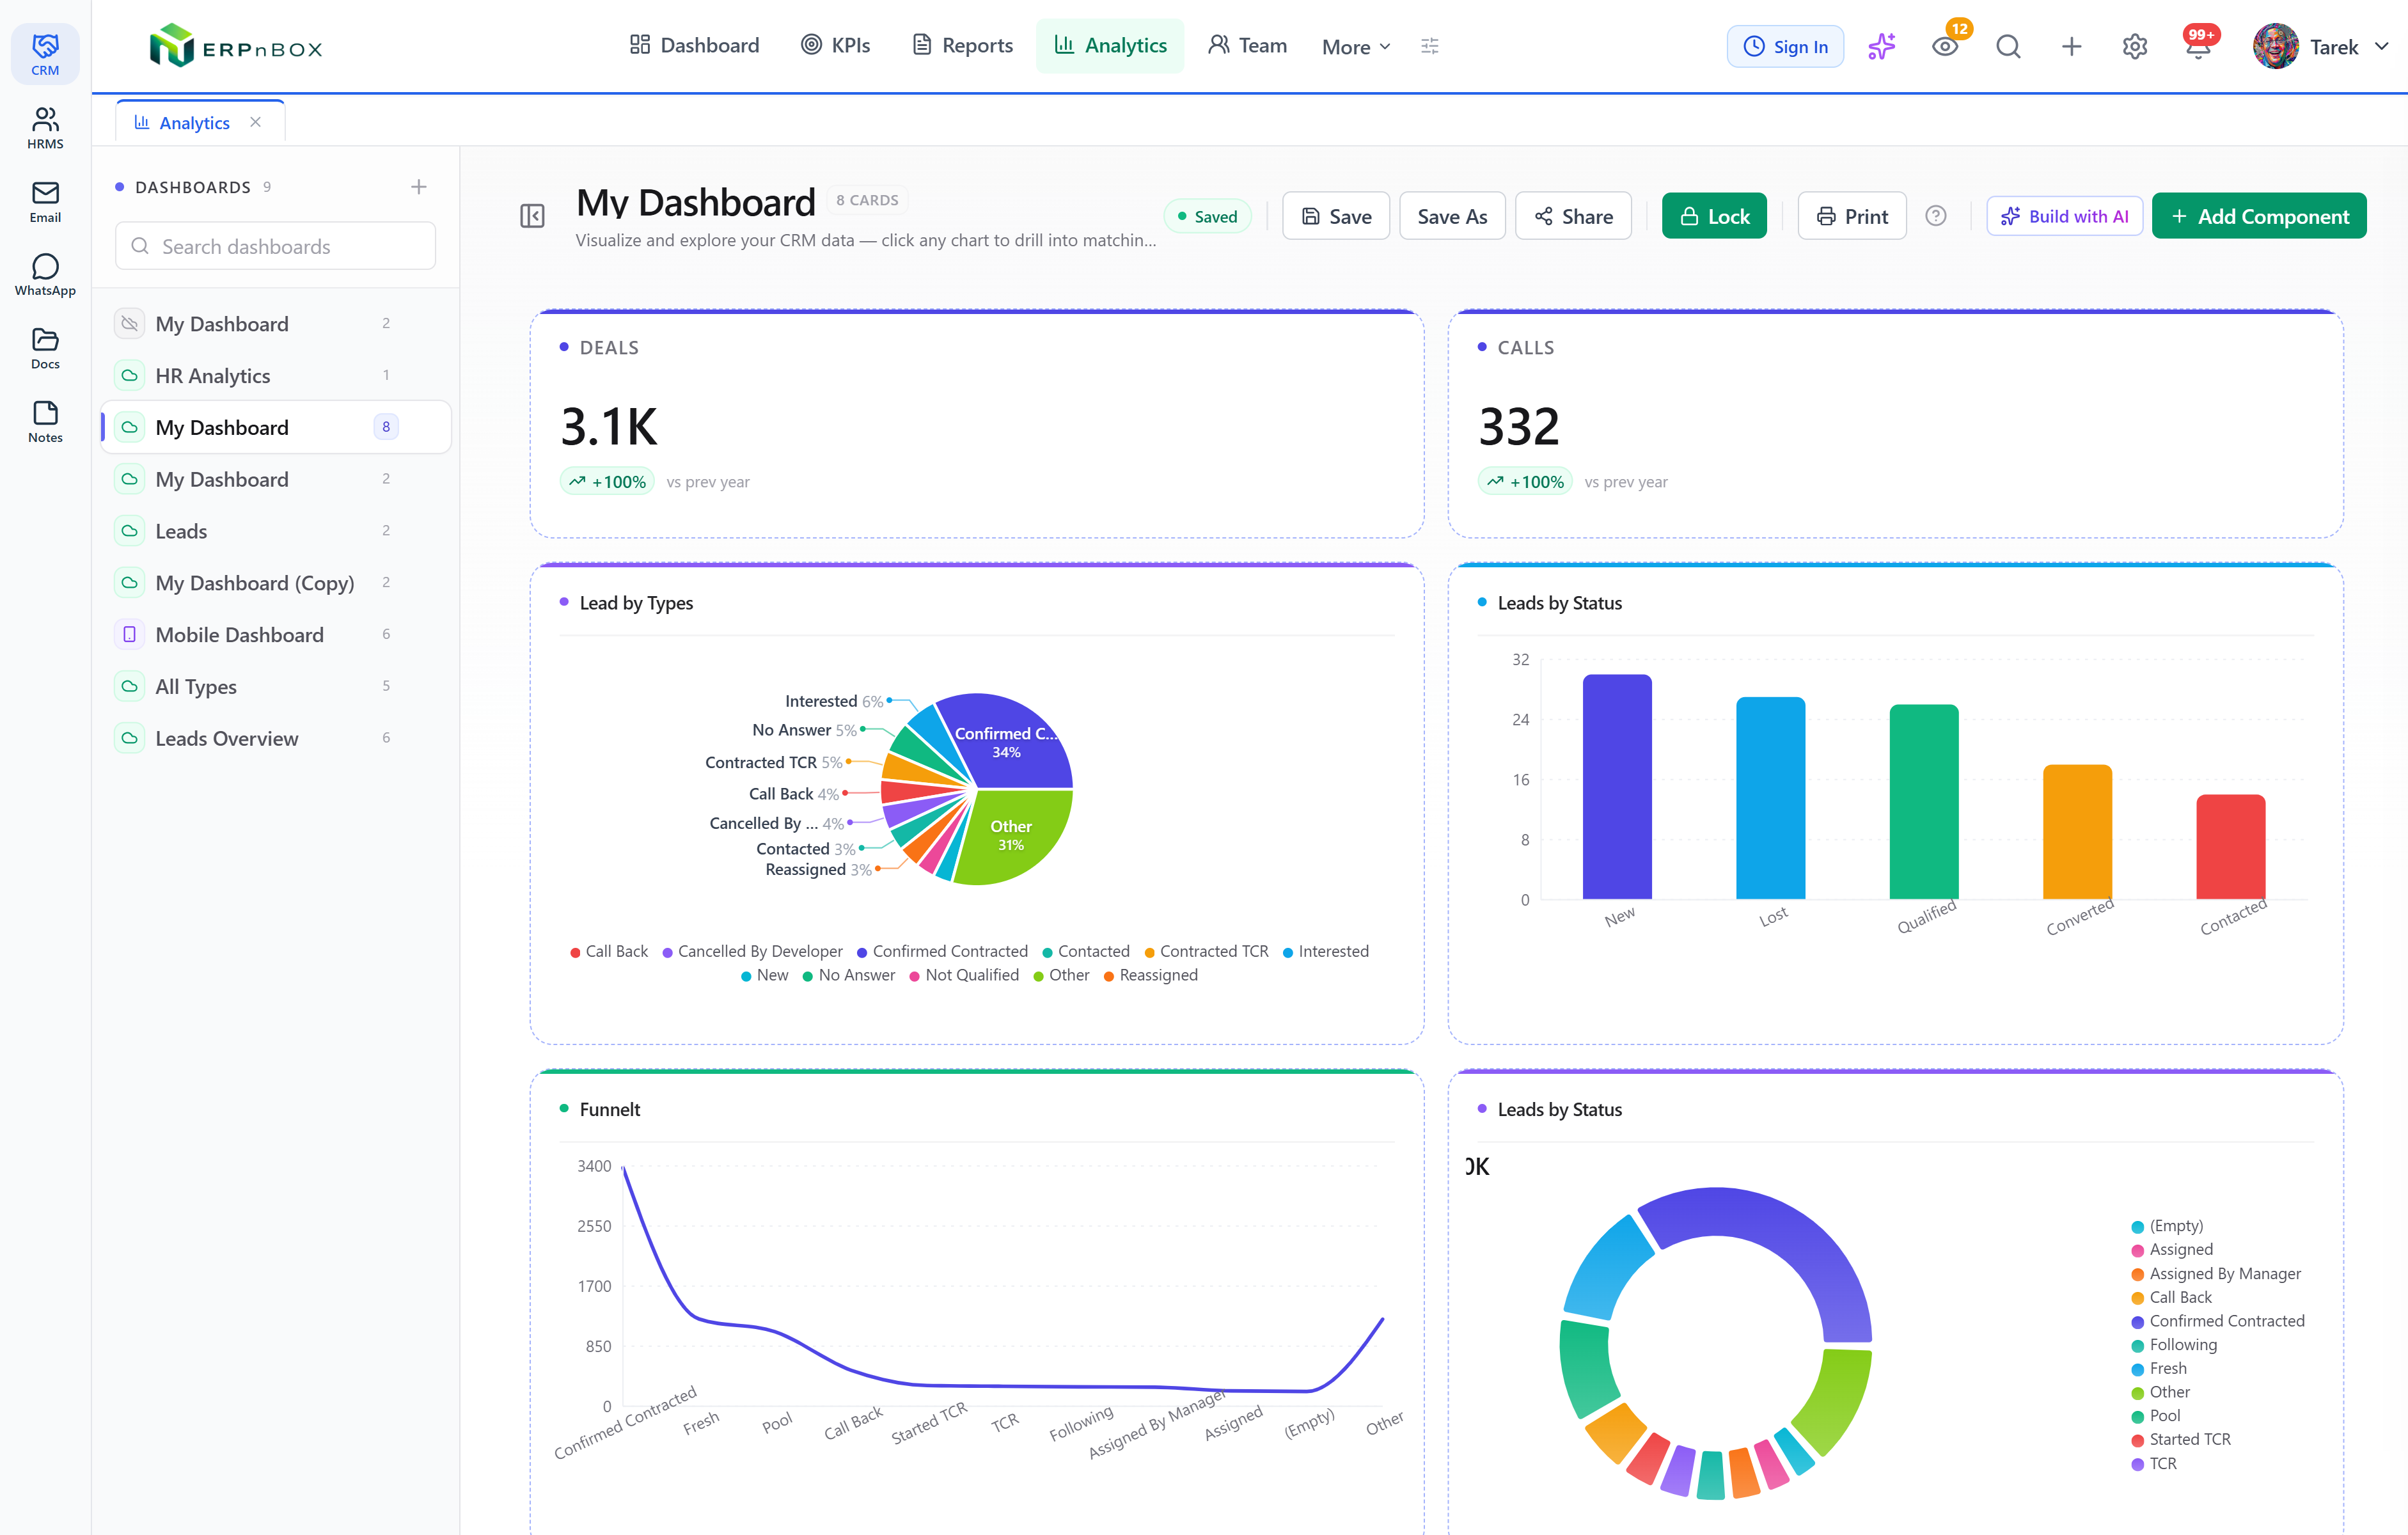
And when you'd rather describe the report than build it, the in-app AI assistant will build it — and whole dashboards — for you. Tell it what you want to see; it assembles the groups, the aggregates, and the charts. It's the fastest way to go from a hunch to a number.
See it on your own numbers
Start a 30-day free trial — no card — and build your first scheduled report before lunch.
Start free trialHow do you build a scheduled report?
Start from the module that holds your data, then shape it in four moves: choose your columns, group the rows, add your aggregates, and save. Turn on a schedule and the report starts arriving on its own. The whole thing takes a few minutes the first time and zero minutes every time after.
- Pick the module — leads, deals, invoices, or any custom module — and choose the columns worth showing.
- Set a row group, like owner or stage, and add filters so the report answers exactly one question.
- Add aggregate columns — sum the deal value, count the records, average the days-to-close.
- Switch to summary or matrix view if you want it grouped or crossed by two dimensions, then save it into a folder.
- Mark it shared for the team, then add a schedule: choose a cadence, add recipients, pick CSV or spreadsheet, done.
That's the shift the Report Builder makes. You stop pulling numbers and start receiving them. The question that used to cost an afternoon now costs one setup — and then it answers itself, week after week, for everyone who needs to know.
Frequently asked questions
Do I need technical skills to build a report?
No. You pick a module, choose columns, group the rows by a field, and add aggregate columns that sum, average, or count. **There's no query language and no data team required.** If you'd rather describe the report in plain words, the in-app AI assistant builds it — and full dashboards — for you.
Can reports be emailed automatically?
Yes. Any saved report can be scheduled to deliver **daily, weekly, monthly, or on a custom cadence** to any list of recipients, as a CSV or spreadsheet file. Set it once and it arrives on its own — no one has to remember to run it.
How do I keep the whole team on the same numbers?
Mark a report as shared and **everyone works from the same definition** instead of five private spreadsheets that quietly disagree. Organize shared reports in nested folders — Sales, Finance, Ops — so the right report is always easy to find.
What can I aggregate in a report?
On any number field you can take a **sum, average, count, minimum, or maximum** — per group and overall. Group deals by owner and sum the value, group invoices by status and sum the balance, or view the same data as a matrix that crosses two dimensions at once.
Can I report on who changed a record and when?
Yes. **Timeline reports** draw on the activity trail across your records, so you can see who changed what and when over any period — useful for auditing pipeline movement, ownership changes, or status updates without digging through individual records.