See the number, then click straight to the records behind it
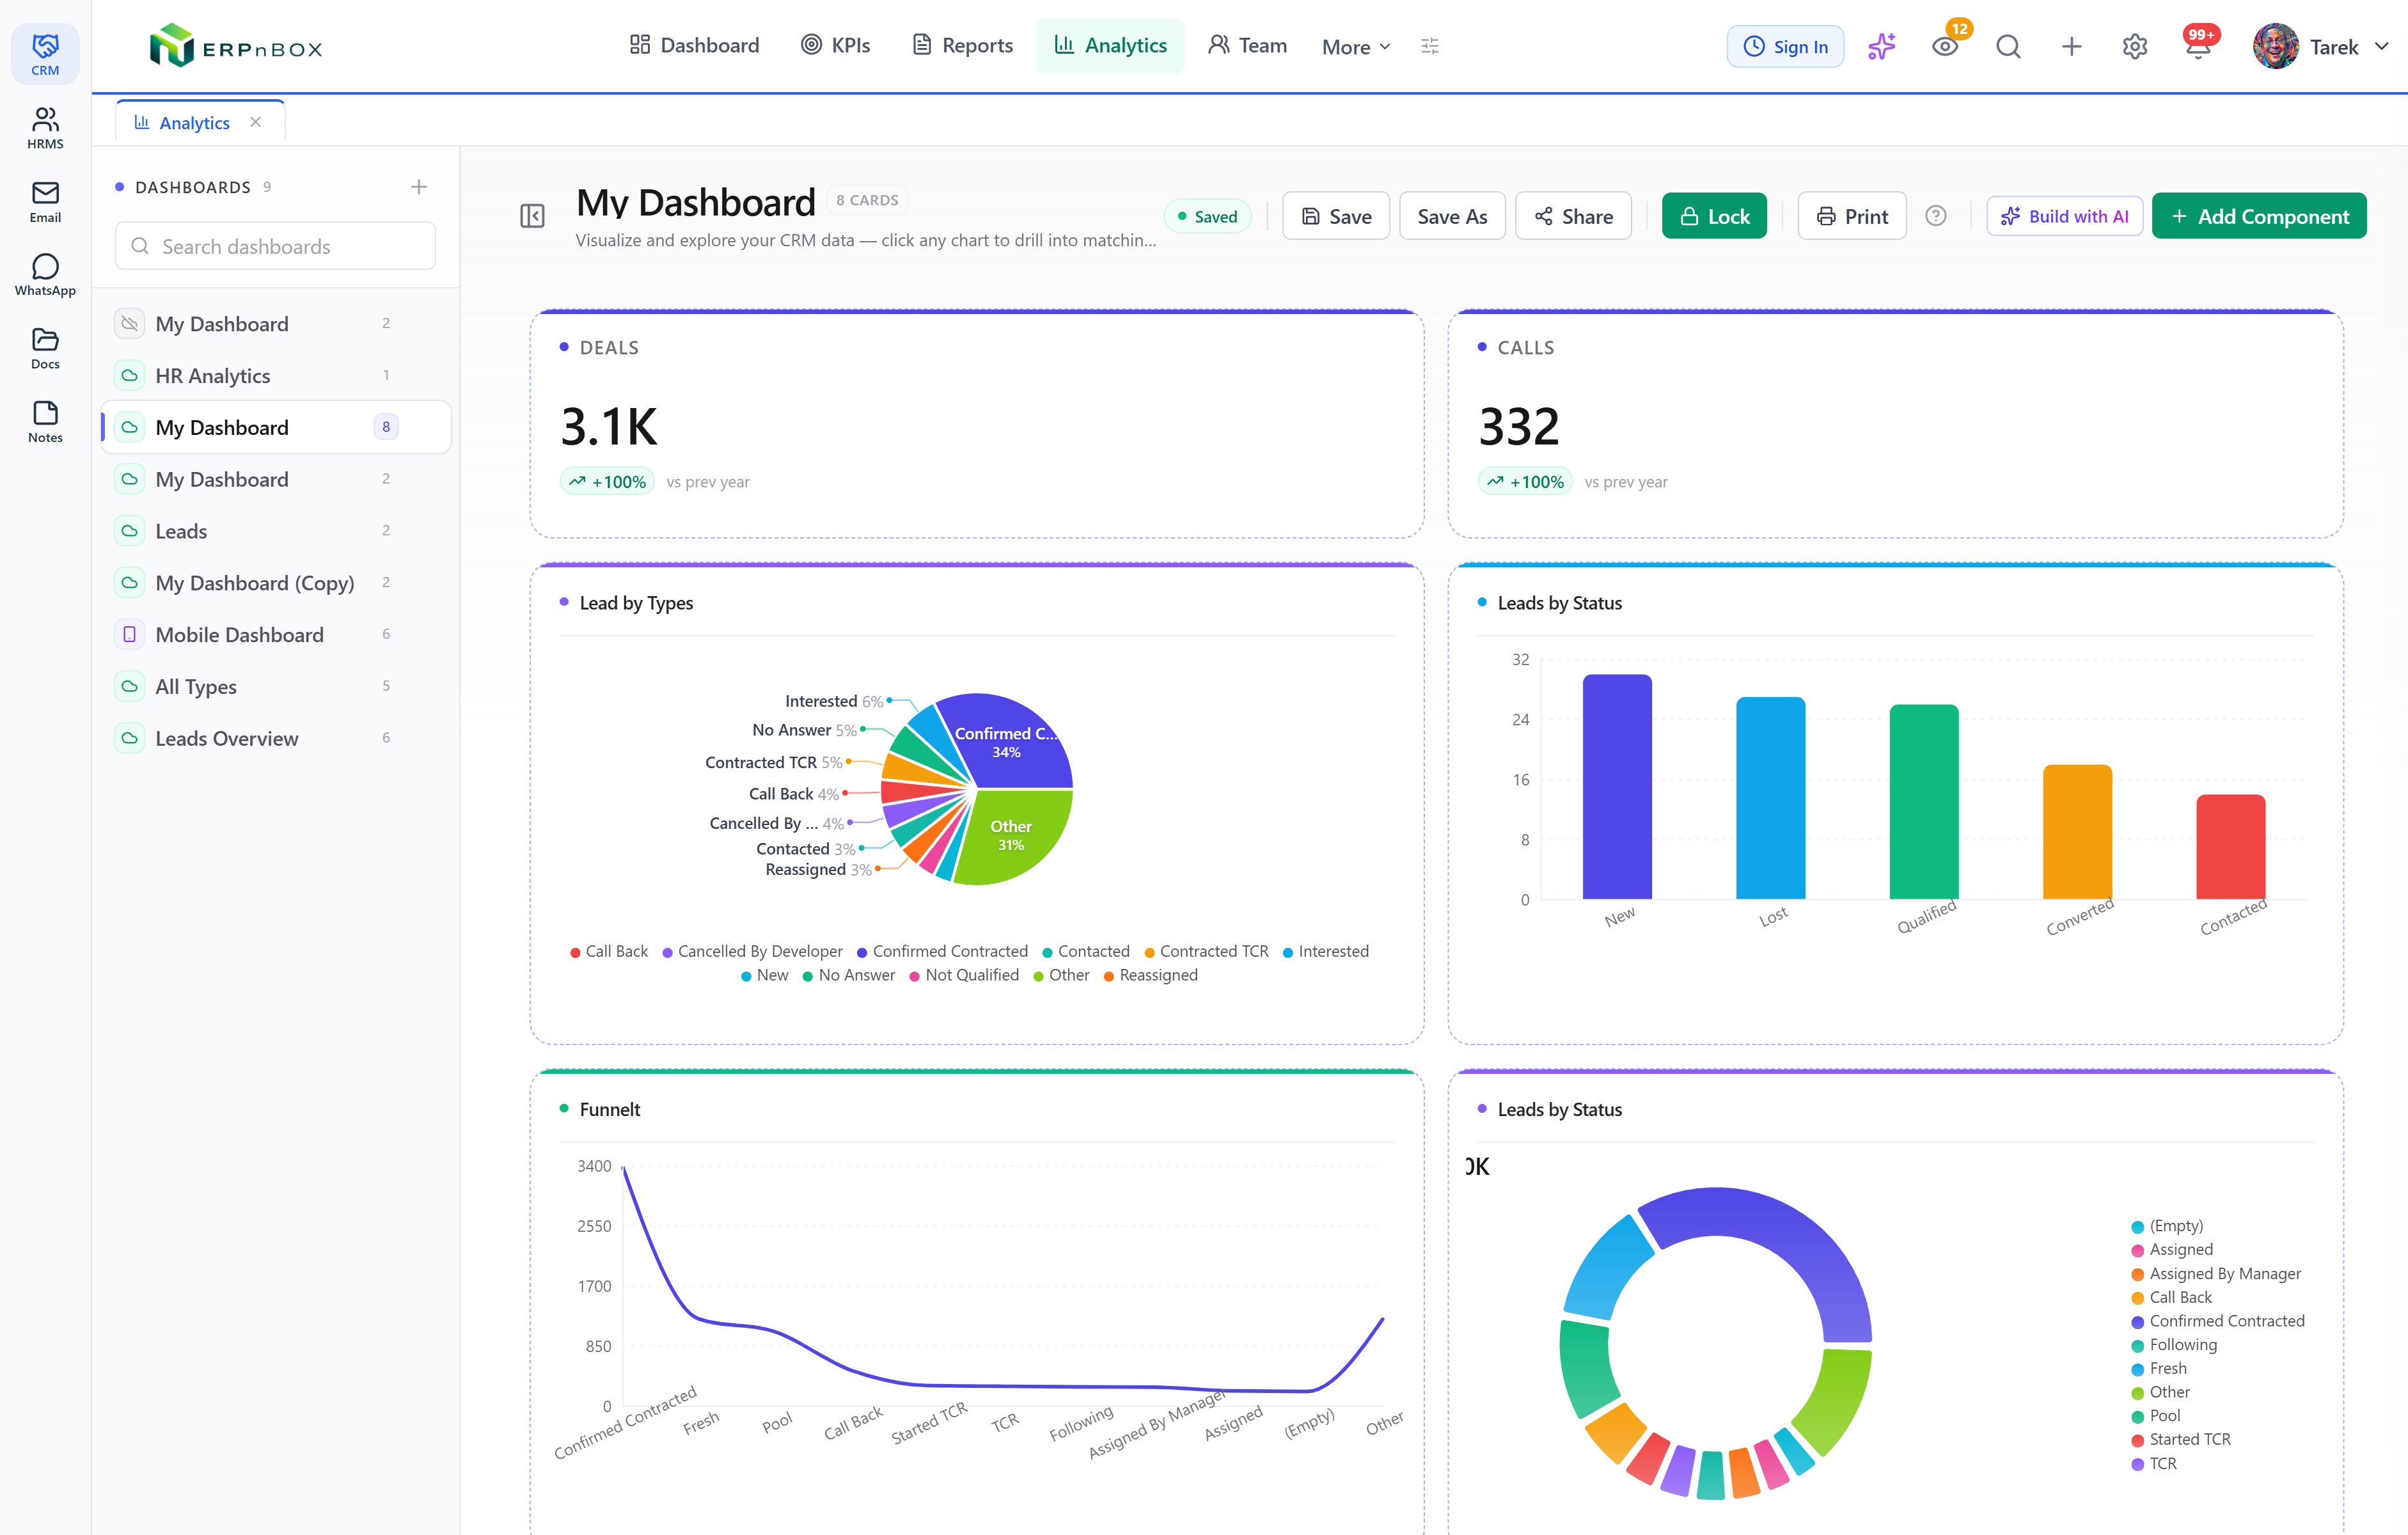
Group by any field, pick any measure, and read your business as a live chart. Every segment is a door — click it and you land on the exact records that make up the total. No export, no spreadsheet, no waiting for Friday.
- Seven chart types, all clickable to the records
- A report builder with groups, totals, folders, and scheduled email
- KPIs with targets, target plans, and progress tracked live
- Leaderboards that roll up your reporting hierarchy
7
Chart types, all with click-to-records
1 click
From a chart segment to its records
0
Spreadsheets to keep in sync
Live
KPI progress against every target
Reporting that answers, not exports
Most reporting stops at a picture. Ours starts there. Choose what to group by, choose what to measure, and the chart appears the way you think about the business — by stage, by owner, by source, by month. Then click any bar, slice, or funnel step and you are looking at the records themselves, ready to work. The question and the answer live in the same place.
Targets that keep everyone honest
Set a target for a person, a role, or a team, group them into target plans, and watch progress fill in as work happens. Leaderboards rank people, teams, and whole branches and roll up through your reporting hierarchy, so a manager sees the full picture and each rep sees exactly where they stand — this week, not next quarter.
01
Seven charts, every one clickable
Bar, column, line, area, pie, donut, and funnel — pick the shape that fits the question. Prefer numbers? Flip any chart to a table view. Whatever you choose, clicking a segment drills straight through to the records behind it, so a chart is never a dead end.
02
A report builder your team will actually use
Build reports with row groups and aggregate columns, tidy them into folders, and have the finished report emailed on a schedule to the people who need it. Cross-module charts pull related data together — deals against their accounts, activities against their owners — in a single view.
03
KPIs, targets, and target plans
Define a KPI, attach a target, and track achievement live against it. Bundle targets into target plans for a season or a quarter, and let each person recompute their own numbers on demand. Everyone works from the same score.
04
Dashboards and saved analytics
Arrange the charts that matter into a configurable dashboard, and save any chart or filter set so it opens the same way tomorrow. Status breakdowns and timeline reports show how records move over time — what is stuck, what shifted, and when.
Full feature list
Everything that's inside
Charts & drill-through
Seven chart types | Bar, column, line, area, pie, donut, and funnel — choose the shape that answers the question at hand. |
Click-to-records drill-down | Click any segment of any chart to land on the exact records behind the number, ready to open and work. |
Table view | Flip any chart to a table when you would rather read the exact figures than the picture. |
Cross-module charts | Bring related data from linked modules into a single chart — records read alongside the modules they connect to. |
Group by any field, any measure | Pick the field to group by and the measure to plot — count, sum, average, and more — and the chart rebuilds instantly. |
Reports
Report builder | Compose reports with row groups and aggregate columns to summarise records exactly the way your team reviews them. |
Folders | Organise saved reports into folders so the right people find the right report without hunting. |
Scheduled email delivery | Send a finished report to chosen recipients on a schedule, so the numbers arrive without anyone asking. |
Status breakdown reports | See how records split across statuses at a glance — how many sit in each stage right now. |
Timeline reports | Track how records changed over time from the audit trail — what moved, when, and by whom. |
KPIs, targets & leaderboards
KPIs with targets | Define a KPI, set a target, and track achievement against it live for a person, role, or team. |
Target plans | Bundle targets into a plan for a season or quarter so the whole team pulls toward one set of goals. |
On-demand recompute | Let each person refresh their own KPI figures on demand and see up-to-the-moment progress. |
Leaderboards | Rank people, teams, and branches by count or aggregate, so everyone can see where they stand. |
Hierarchy roll-up | Leaderboards roll up through your reporting lines, so a manager sees their whole org at once. |
Dashboards & saved analytics
Configurable dashboards | Arrange the charts and KPIs that matter to you into a dashboard laid out your way. |
Saved analytics & filters | Save any chart or filter combination and it opens the same way every time you return. |
Owner, team & reporting-line filters | Slice any chart or report by owner, team, or reporting line to focus on exactly the group you mean. |
Explore more
Frequently asked questions
Can I get from a chart to the actual records?
Yes — that is the point. Click any segment of any of the seven chart types and you land on the exact records behind the number, ready to open and work. Prefer figures to pictures? Flip the same chart to a table view.
What chart types are available?
Seven: bar, column, line, area, pie, donut, and funnel. Group by any field and plot any measure — count, sum, average, and more — including cross-module charts that combine data from linked modules.
Can reports be emailed automatically?
Yes. Build a report with row groups and aggregate columns, keep it in a folder, and schedule it to email the right recipients on a recurring basis. The numbers arrive on their own.
How do targets and leaderboards work?
Set a KPI target for a person, role, or team, and group targets into target plans. Progress tracks live, and each person can recompute their own numbers on demand. Leaderboards rank people, teams, and branches and roll up through your reporting hierarchy so managers see the whole picture.
Does it do sales forecasting or predictive analytics?
No. The analytics report on what has actually happened in your records — targets, breakdowns, timelines, and leaderboards — not predicted or machine-learned forecasts. You see the real numbers, not a guess.
Can I save a chart or dashboard so it stays set up?
Yes. Save any chart or filter combination and it reopens exactly as you left it, and arrange the charts and KPIs you care about into a configurable dashboard laid out your way.
Run your whole sales team on ERPnBox
Describe your business and AI sets up your CRM. Start free, no credit card.