The short answer
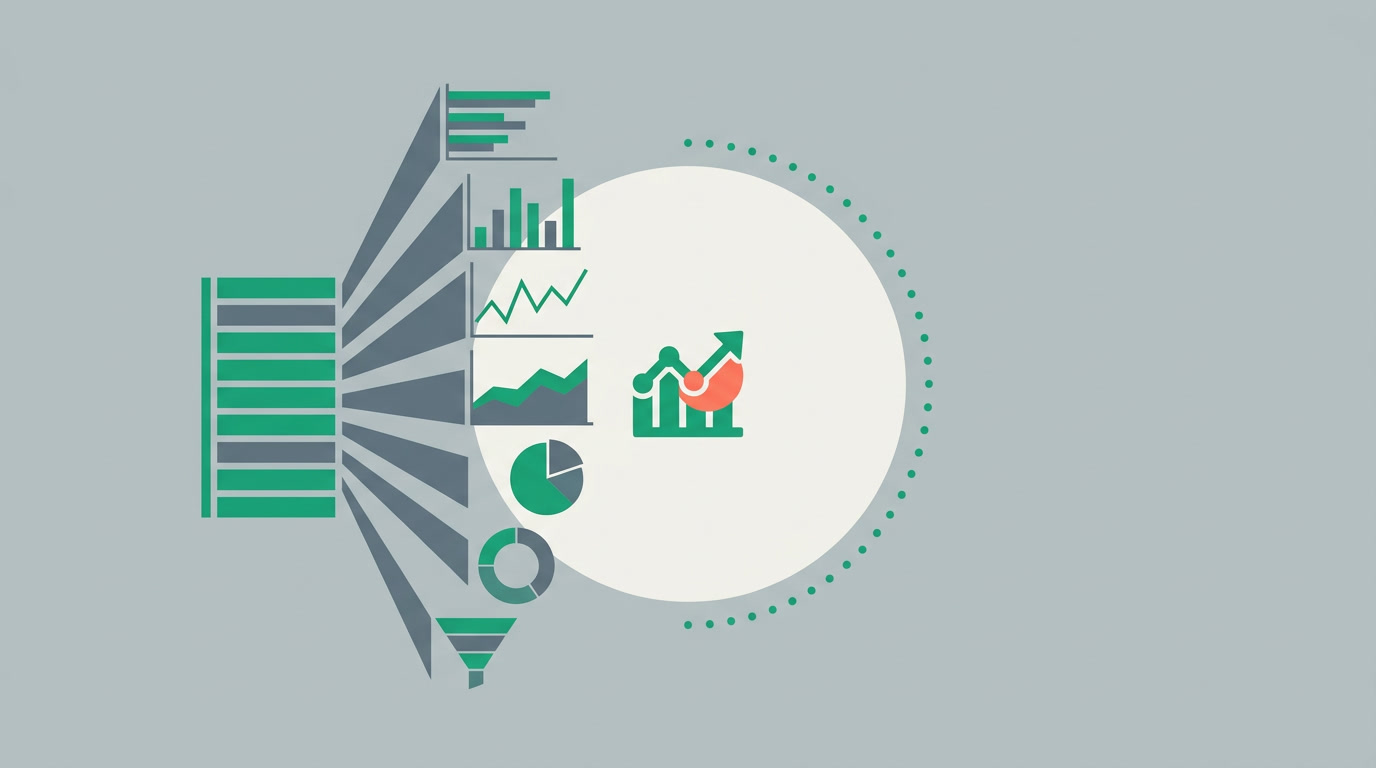
ERPnBox charts group any list by a field and measure either a count of records or a sum of a number field. Bar and column compare categories, line and area show change over time, pie and donut show share, and funnel shows drop-off across stages. Standard charts — you read what happened, not a prediction.
A list tells you the rows. A chart tells you the shape. The gap between the two is one decision you make in about ten seconds: pick a field to group by, pick what to measure, pick the chart type that fits the question. ERPnBox gives you seven standard chart types built straight on top of the chart view, and none of them require code — you configure, you don't code.
How does grouping and measuring actually work?
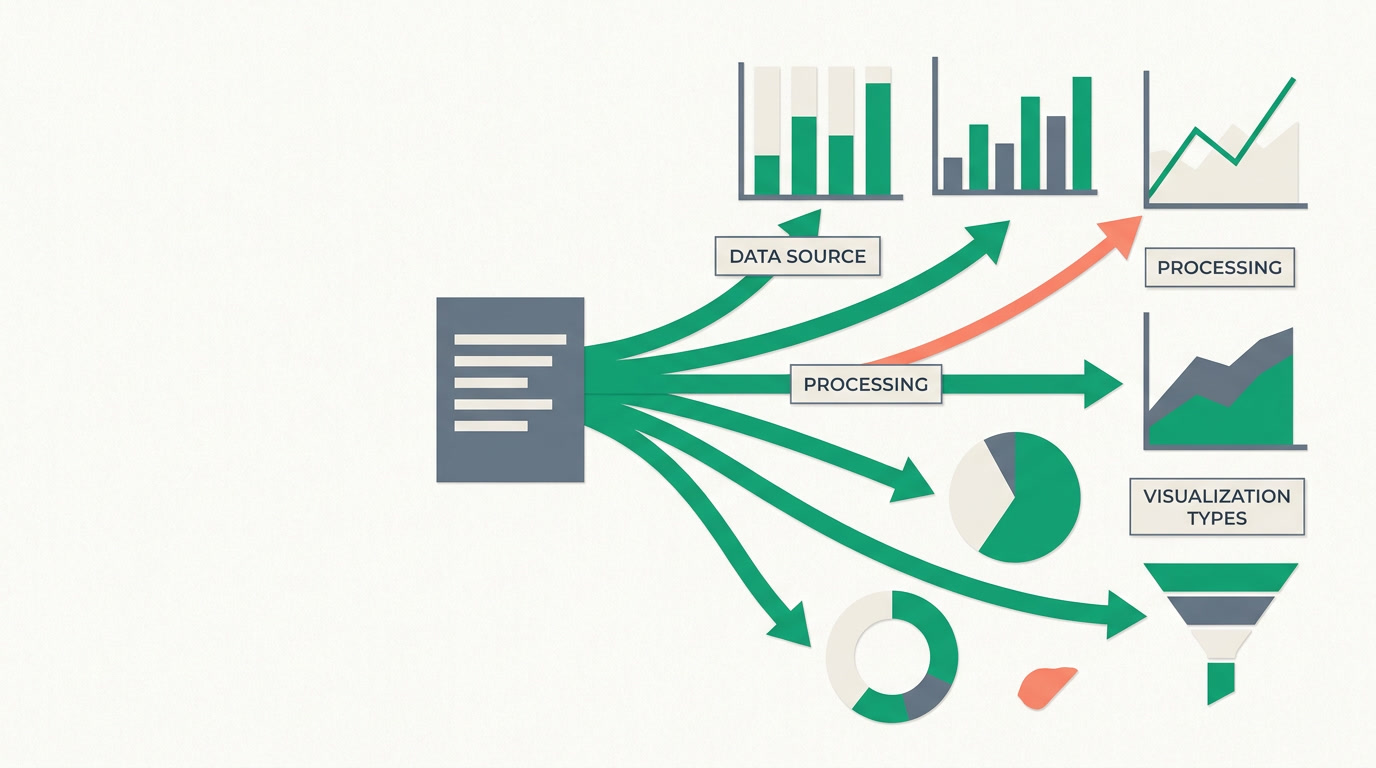
Every chart rests on two choices. The group-by field splits your records into categories — one bar, slice, or point per value. The measure decides the height of each: either a count of records in that group, or a sum of a number field across them. Everything else is just which shape you draw.
Group leads by Stage and count them, and you see how many sit in each pipeline stage. Keep the same grouping but switch the measure to sum of Deal Value, and the same categories now show money, not headcount. The question changed; the field didn't. That swap — count versus sum — is the single most useful lever on the whole screen.
Rule of thumb: count answers "how many?" and sum answers "how much?" If your question has a currency sign or a quantity in it, you want sum of a number field.
Which chart type answers which question?

The type is not decoration — it is the reading. Bars and columns compare separate categories. Lines and areas trace change over time. Pie and donut show share of a whole. Funnel shows how many survive each stage. Match the shape to the sentence in your head and the chart reads itself.
| Chart type | Best question it answers | Typical setup |
|---|---|---|
| Column | Which category is biggest, side by side? | Group by Source, count records |
| Bar | Same, but with long category names | Group by Owner, sum Deal Value |
| Line | How did this move over time? | Group by Created month, count |
| Area | Same trend, emphasizing volume | Group by month, sum Revenue |
| Pie | What share does each part hold? | Group by Industry, count |
| Donut | Share of a whole, with a clean center | Group by Status, count |
| Funnel | How many survive each stage? | Group by Stage, count records |
When should you use bar versus column?
They carry the same information — a value per category — but they read differently. Columns stand vertically and suit short labels and a handful of categories. Bars lie horizontally and rescue you when labels are long, like owner names or full sources, because the text has room to breathe.
Both shine at the same job: ranking. Sort the groups and the tallest bar or column is your answer at a glance — the top source, the busiest owner, the leakiest reason for lost deals. Save that as one of your saved views and the ranking is a click away every morning.
When do line and area beat everything else?
The moment your question contains "over time." Group by a date field bucketed into months or weeks, and line traces the movement — new leads climbing, closed deals dipping in a slow quarter. Area does the same but fills underneath, which nudges the eye toward volume rather than the exact turn.
Be honest about what a line shows: it draws what already happened, month by month. It is a rear-view mirror, not a crystal ball — ERPnBox charts do not forecast or predict. The trend is real; the future is still your call.
What are pie, donut, and funnel really for?
Pie and donut answer "what share?" — the slice of leads from each source, the split of accounts by industry. Keep the categories few; a pie carved into fifteen slivers tells you nothing. The donut's hollow center simply reads cleaner and gives you a spot for a total. Reach for them when the parts should add up to a meaningful whole.
Funnel is the pipeline's native shape. Group by Stage, count the records, and each band shows how many made it that far — a wide mouth of new leads narrowing to a thin tail of won deals. The steep drops are where your process bleeds, and the funnel points at them without a word.
The chart type is the question, not the picture. Change the shape and you have asked something new of the same rows.
How do you build one from a list?
You start where the data lives. Open any module, apply the filter that scopes the records you care about, then switch to the chart view — see all view types for the full set. Choose your group-by field, set the measure to count or sum, and pick a type. Because the chart sits on the same filtered list, narrowing the filter narrows the chart — one dataset, seven readings.
That is the whole discipline. Not dashboards you commission and wait a week for — a chart you spin up the instant a question lands, off a list you already trust. When the question changes, you change the shape, and the answer arrives before the meeting does.
Turn your lists into answers
Group, measure, and chart your CRM data without waiting on anyone. Start free and see the shape of your pipeline today.
Start freeFrequently asked questions
Can ERPnBox charts predict or forecast future numbers?
No. These are **standard charts** that plot what your records already contain — counts and sums of real data, grouped by a field. A line chart shows the trend that happened, month by month, but there is ==no prediction, machine-learning forecast, or projection==. You read the past clearly and decide the future yourself.
What is the difference between count and sum as a measure?
**Count** tallies how many records fall in each group — how many leads per source. **Sum** adds up a number field across each group — the total deal value per owner. Same grouping, different question: count answers "how many," sum answers "how much." You switch between them without rebuilding the chart.
Which chart should I use for my sales pipeline?
A **funnel**, grouped by Stage and counting records, is the natural fit — each band shows how many deals reached that stage, and the narrowing points straight at where you lose momentum. If you would rather compare the money in each stage, keep the grouping and switch the measure to sum of your value field.
When should I choose a bar chart over a column chart?
They show the same values; pick by label length. Use **columns** for short labels and few categories, and **bars** — which run horizontally — when category names are long, like full owner names or source labels, so the text stays readable. Both are ideal for ranking categories from biggest to smallest.
Do charts update when I change the list filter?
Yes. A chart is built on the **same filtered list** it lives in, so narrowing or widening the filter reshapes the chart with it. That is what makes it fast — you scope the records you care about, then read them as a shape, without exporting anything or asking for a report.