The short answer
Chart view turns a CRM module's records into a live bar, line, or pie chart right from the list. Pick a field to group by, choose count or sum, and the chart draws itself. No separate report builder, no export to a spreadsheet. Switch back to the table anytime — same records, different lens.
You open a module of a few hundred records to answer one small question: how many are in each stage? In a table, you sort, you squint, you count. The answer is in there — it's just wearing a disguise. The Chart view takes it off. It reads the same records you're already looking at and draws them as a bar, line, or pie chart, counted or summed by the field you care about.
What is the Chart view, exactly?
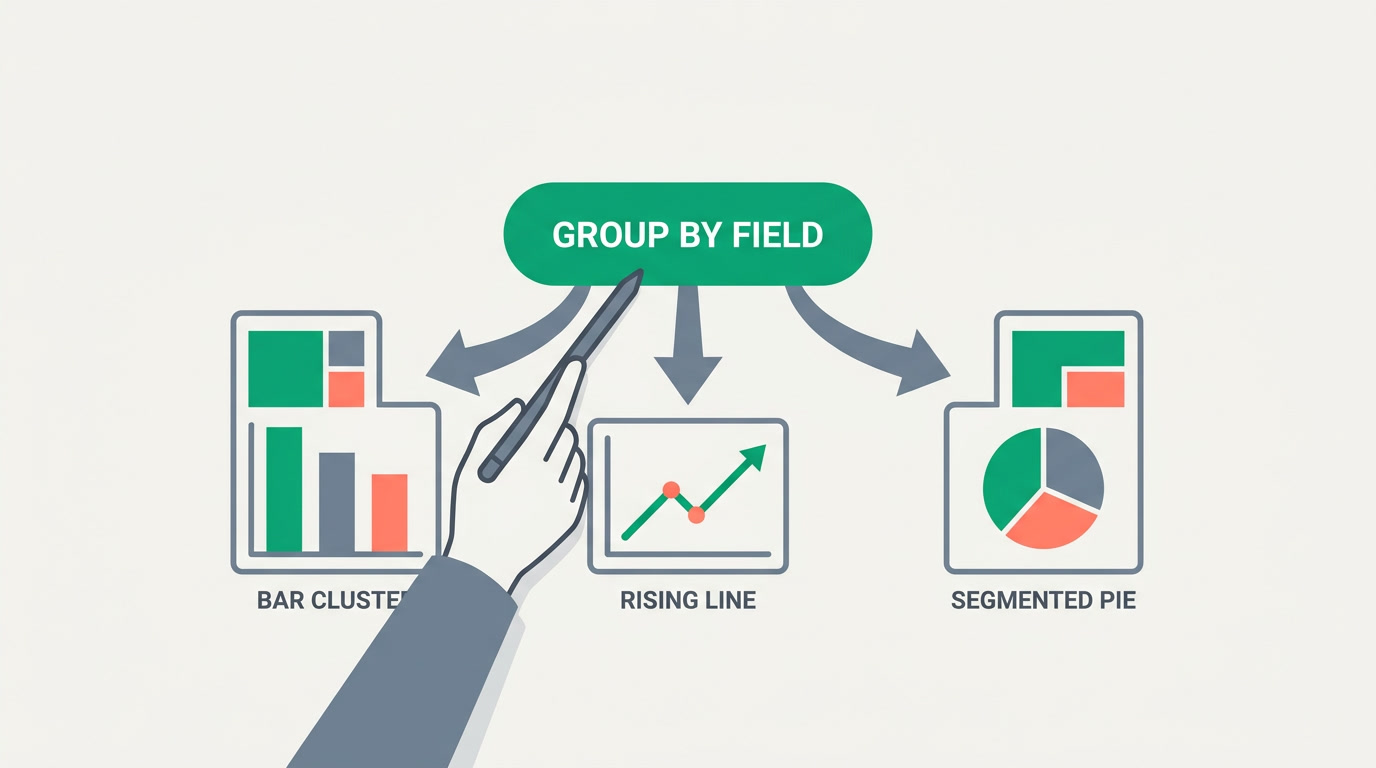
The Chart view is one of the view modes on every CRM module — sitting beside List, Kanban, Calendar, and Card. Instead of listing records as rows, it counts or sums them by a field you pick and renders the result as a standard chart — bar, line, pie, or grouped bars. It's a live view of the same data, not a snapshot you have to refresh.
Two choices shape the picture. First, the field you group by — stage, owner, source, city, month — which becomes the categories along the chart. Second, the measure: count the records in each group, or sum a number field like deal value. Change either one and the chart redraws on the spot. To be clear about what it is not: these are ordinary chart types. There is no prediction, no forecast, no machine guessing — just your records, drawn honestly.
Chart view vs. the analytics dashboard
Chart view lives inside a single module's list and answers a quick question about the records in front of you. For saved, multi-chart dashboards you return to daily, use the full analytics. Think of Chart view as the fast lane and analytics as the reporting room.
When does a chart answer faster than a table?
A chart wins the moment your question is about shape rather than detail — how many, how much, which is biggest, where the pile-up is. A table is the right tool when you need a specific record; a chart is the right tool when you need the distribution across all of them. If you catch yourself sorting a column just to eyeball the balance, that's the signal to switch.
| The question you're asking | Reach for | Why |
|---|---|---|
| How many leads per source? | Chart (pie or bar) | Distribution across one field |
| Total deal value by stage | Chart (bar, sum) | A sum, grouped, at a glance |
| New records added each month | Chart (line) | A trend over time |
| Show me the details of one deal | List / Detail view | You need the record itself |
| Work items down a pipeline | Kanban view | You drag cards between stages |
How do you turn on a chart from the list?
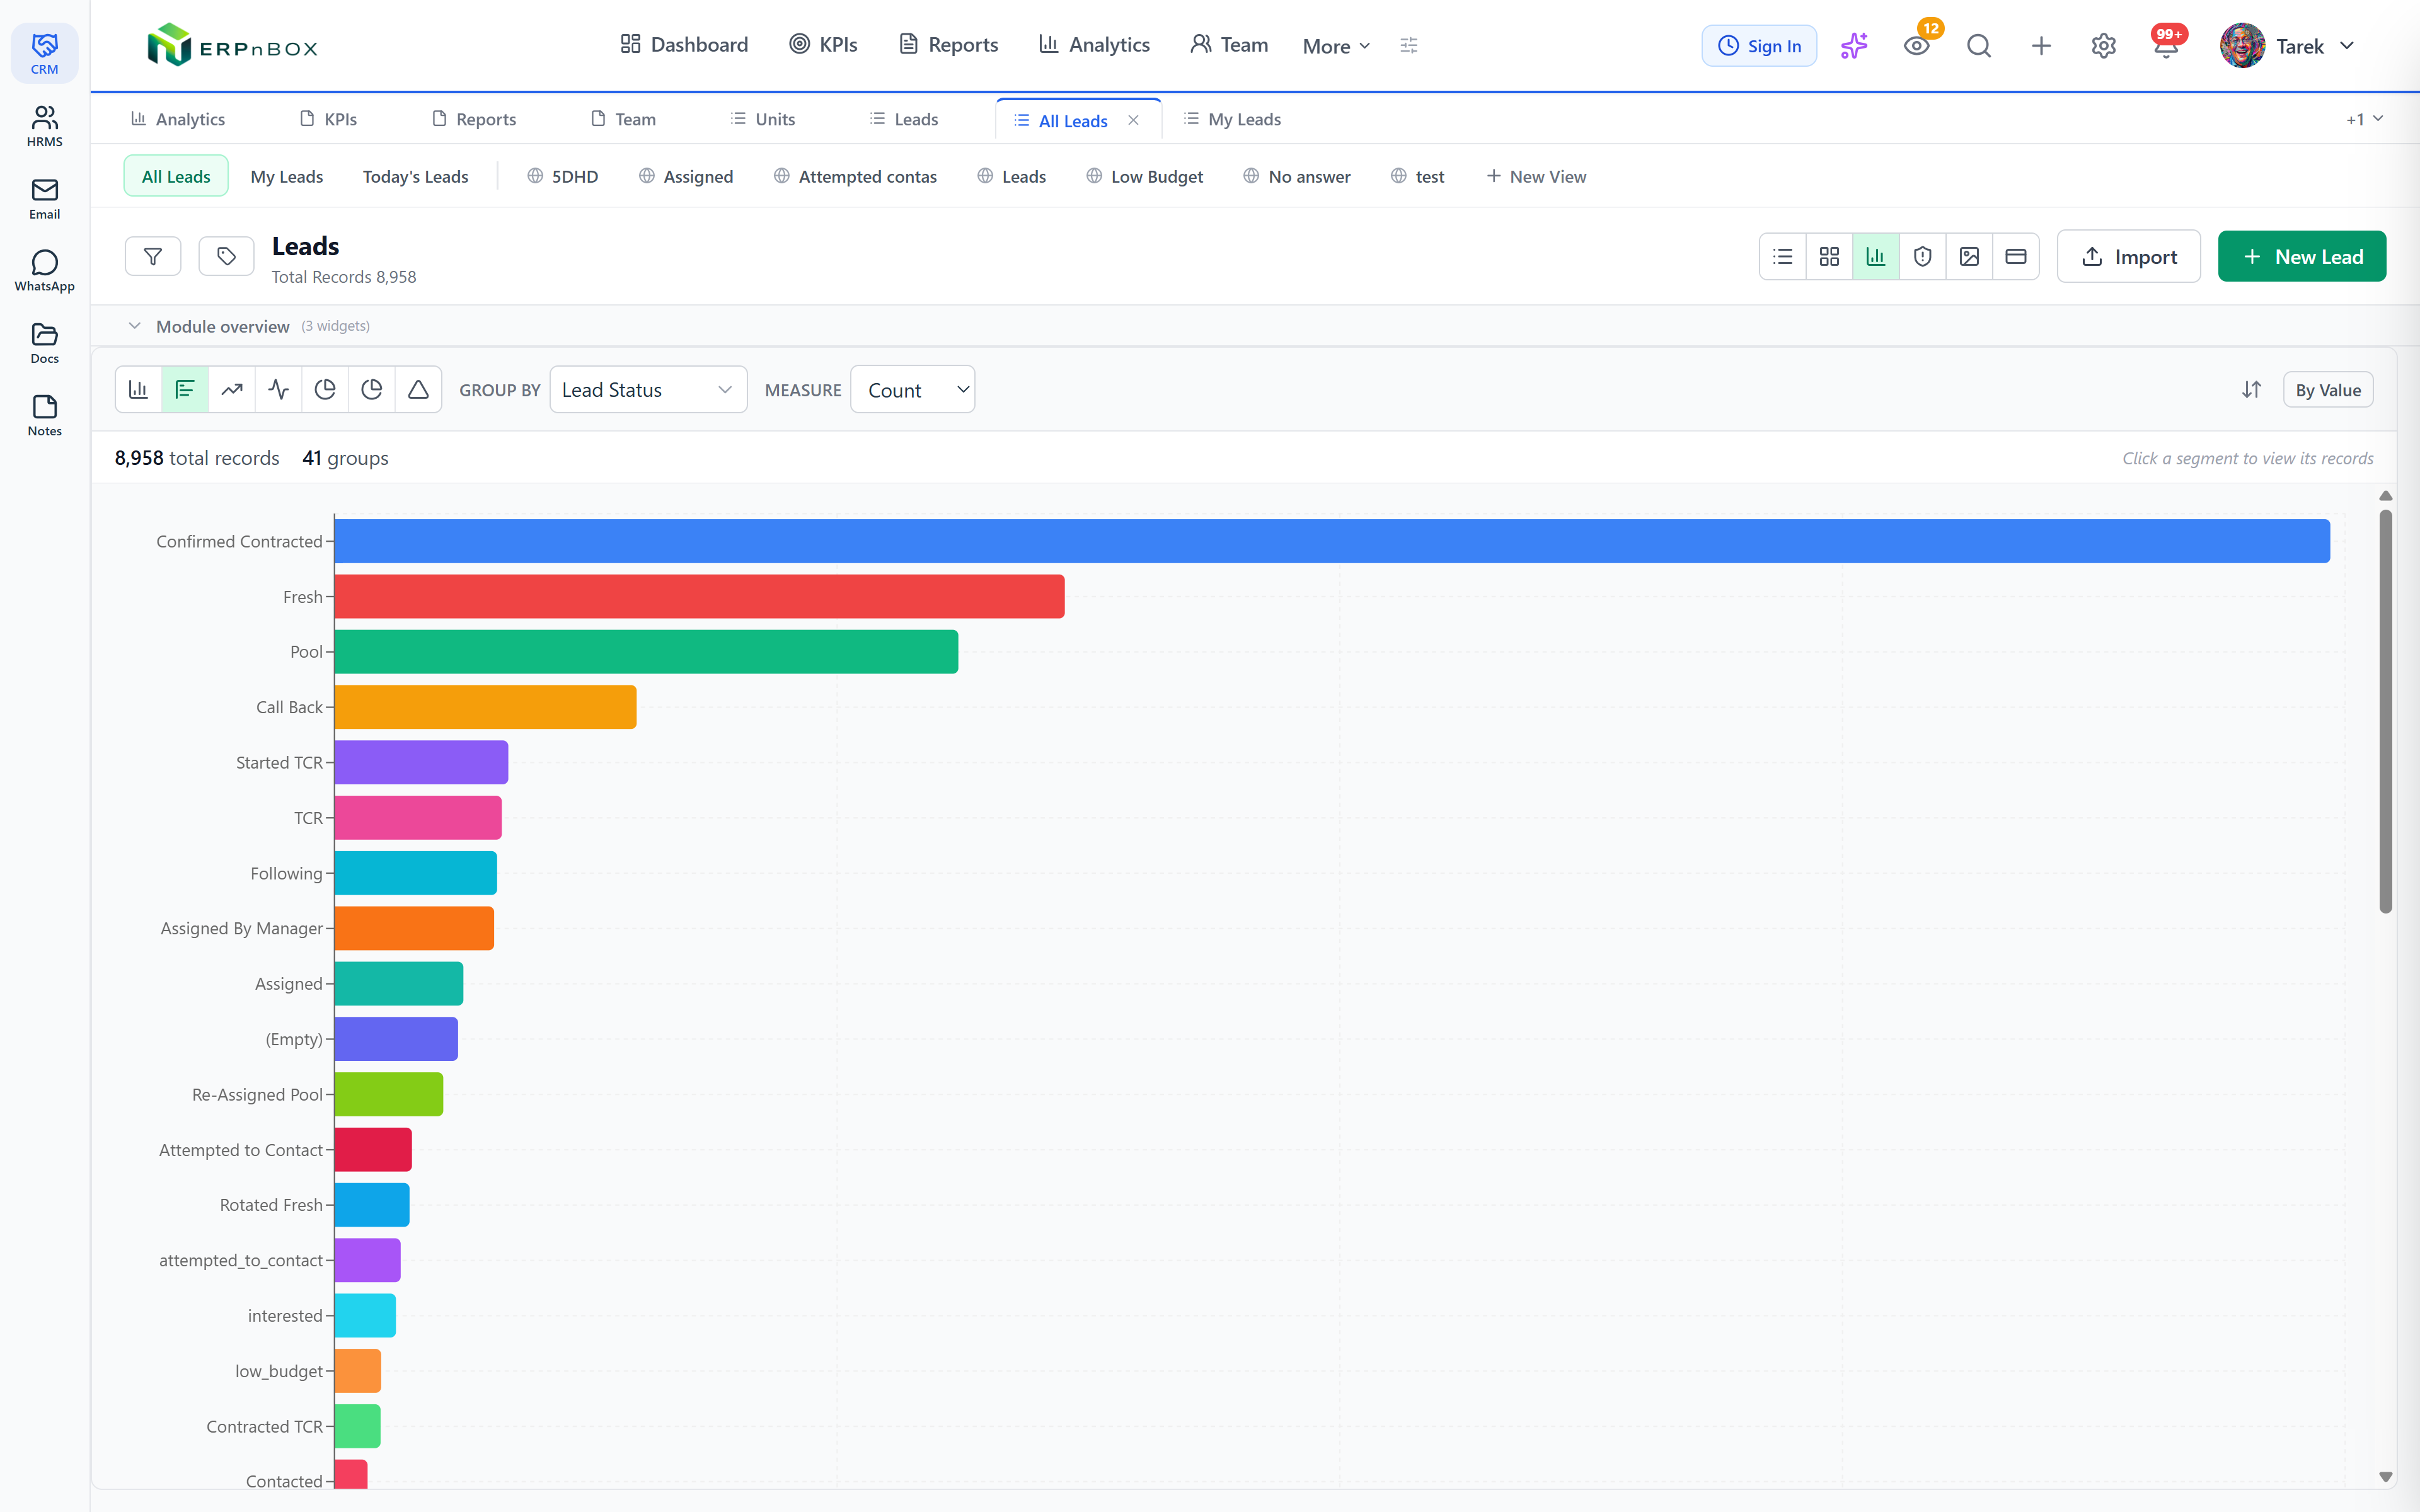
You don't leave the module and you don't write a formula. Open any module's list, switch the view to Chart, pick the field to group by and the measure, and the chart appears. The whole thing is configuration, not code — three choices and you're looking at the answer. Here is the short version:
- Open the module and use the view switcher on the list to choose Chart.
- Pick the field to group by — stage, owner, source, or a date field for a trend.
- Choose the measure: count the records, or sum a number field like value or quantity.
- Pick the chart type — bar, line, pie, or grouped — whichever reads clearest.
- Narrow first if you like: apply a filter, then chart only what's left.
- Save the view so the chart is one click away next time.
A quiet, useful habit: filter, then chart. Because Chart view reads the current list, any global search filter or saved filtered view you've applied carries straight through. Chart the records for one owner, one region, or this quarter only — the chart respects the same fence the list does.
Who on the team actually uses it?
Anyone who lives in a module and gets asked a number. A sales lead charts pipeline by stage before a standup. An ops manager sums open tickets by priority. A marketer pies leads by source to see which channel is pulling. Nobody has to open a separate reporting tool for a question that lasts thirty seconds.
The best report is the one you never had to build. If the answer is already in the list, the list should be able to show it.
What can't the Chart view do?
It's deliberately narrow, and that's its virtue. It draws what's true today — no forecasting, no trend prediction, no scoring. It's a single chart per view, tied to one module, not a multi-panel dashboard. For layered reports, comparisons across modules, and boards you revisit daily, that's the job of the full analytics. Chart view is the quick answer; analytics is the standing report.
See your records draw themselves
Every CRM module ships with the Chart view built in — no report builder, no code. Start free and switch a list into a chart today.
Start freeFrequently asked questions
Do I need to build a report to see a chart?
No. The Chart view lives right on a module's list. You **switch the view, pick a field to group by, and choose count or sum** — the chart draws immediately. There's no separate report builder to open and nothing to export to a spreadsheet first.
What chart types are available?
Standard ones — **bar, line, pie, and grouped bars**. You choose whichever reads clearest for your question: pie for a share of a whole, line for a trend over a date field, bar for straight comparison. These are ordinary charts, not predictive or AI-generated.
Can I chart only the filtered records?
Yes. The Chart view reads the **current list**, so any filter or saved filtered view you've applied carries through. Filter to one owner, region, or date range first, then switch to Chart — you'll only see what's left.
Can I save a chart to come back to it?
Yes. Like the other view modes, a Chart view can be **saved** so it's one click away next time — the same grouping, measure, chart type, and any filter, ready whenever you open the module.
Does the Chart view predict or forecast anything?
No. It draws **what's true right now** from your records — counts and sums, grouped by a field. There's no forecasting, scoring, or machine prediction. If a number changes in the data, the chart simply reflects it.
When should I use Chart view instead of Kanban or a table?
Use **Chart** for a distribution question — how many or how much, grouped. Use a table when you need a specific record, and use [Kanban](/features/crm-kanban-view) when you want to drag work between stages. Same records, different lens for each job.